Investing can seem daunting, especially with all the gimmicks online that tote huge returns for a down payment. The struggle is for real. What should you put your hard earned money into? Investing into the right securities is essential, but the true key to investing is to grow your principal. A good analogy that everyone can relate to is the “snowball” effect. When your principal gets larger, then expect to see larger gains/losses. Interest payments are the same idea, but in reverse. The larger your principal, the larger your interest payments. The “principal” in these cases is just the total account value/debt.
Investing is essential for growing your net worth and making the most out of your money. There are so many ways to invest, so don’t just hop into anything without due diligence. Nothing in this blog constitutes financial advise, my blog and I are not responsible for what you do with any of this information. Please read the DISCLAIMER if you have any questions.
In this post I am going to show you why passively investing is better than linearly saving. We will simulate both methods through code and assess the results in a single graph which will clearly show the better investment method.
With the linear saving model, we will pretend to put 20 dollars aside in a savings fund every single day. With the passive investing model, we will pretend to put 20 dollars into a savings fund while also investing the lump sum (of the savings fund) into bitcoin everyday. The passive investment model will also incorporate a one percent stop loss. We will use the daily closing price data for bitcoin from 12/13/2020 until 4/27/2022.
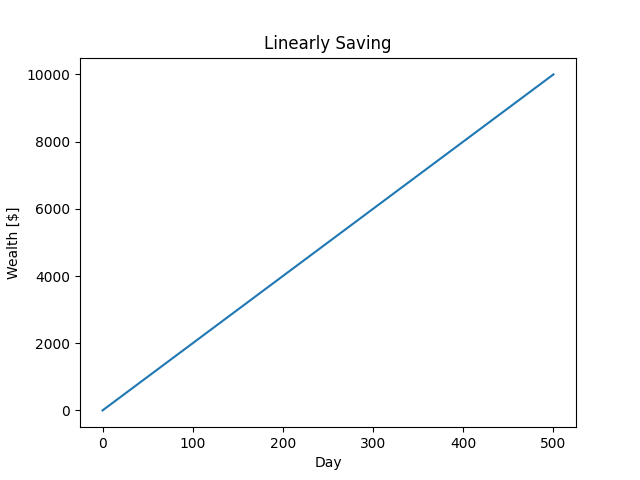
Below is the code that simulates a linear savings model. Super simple. Take a look at the output graph below. The line represents your savings over a period of 500 days which grows at a constant rate, i.e. 20 dollars per day.
import matplotlib.pyplot as plt

linear_wealth = [0]
days = 500

for day in range(days):
    linear_wealth.append(linear_wealth[-1] + 20)

plt.plot(range(len(linear_wealth)), linear_wealth)
plt.title("Linearly Saving")
plt.xlabel("Day")
plt.ylabel("Wealth [$]")
plt.show()

Now lets talk about the passive investment method. Lets pretend to invest into bitcoin over the same period of 500 days while still putting 20 dollars into the account each day. Here is the DATASET. Below is a graph showing the closing prices from the dataset over the 500 day period. Notice how the price is very volatile, but trending upwards over the 500 day period. For the passive investment model to work well, you must be investing into securities that exhibit this same behavior. That begs the question, what should you invest in? Well, that is for you to decide and is outside the scope of this post. Additionally, nothing in this blog constitutes financial advise, so please consult with your certified financial planner when making investment decisions.

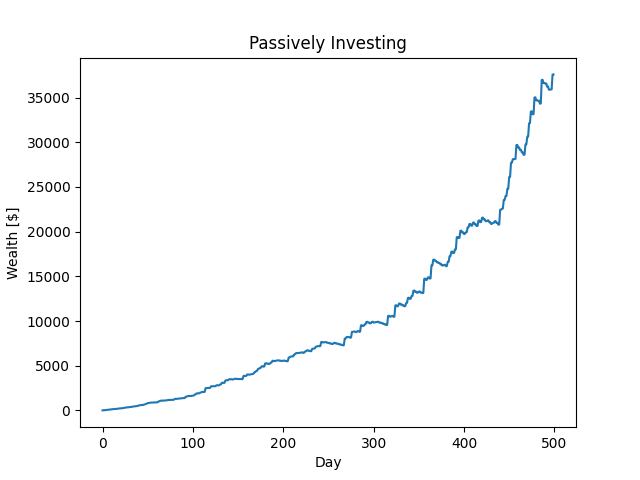
“passive investing” in this post means that each day, our entire account balance will be invested into bitcoin at that days’ closing price. Below is the code that simulates a passive investment model. First, a list called “rois” is created which represents the return on investment for each day in the dataset. The “rois” list is calculated using the .pct_change() method. Additionally, there is a one percent stop loss that triggers if the corresponding days’ roi is less than negative one percent. Please note that this code is not a truly accurate simulation because of intraday variability. There are many events that would trigger a one percent stop loss, even on days where are positive roi is present. So, take this model with a grain of salt. With that being said, this model still gives you a good idea as to why passively investing in an upward trending security is better than linearly saving.
import pandas as pd
import matplotlib.pyplot as plt

df = pd.read_csv("data/BTCUSDT_1d.csv")
df['rois'] = df['close'].pct_change()
df.dropna(inplace=True)
rois = list(df['rois'])

wealth = [0]
days = len(rois)

for day in range(days):

    wealth.append(wealth[-1] + 20)

    if rois[day] < -0.01:

        wealth.append(wealth[-1] + wealth[-1]*-0.01)

    else:

        wealth.append(wealth[-1] + wealth[-1]*rois[day])

plt.plot(range(len(wealth[:len(rois)])),wealth[:len(rois)])
plt.title("Passively Investing")
plt.xlabel("Day")
plt.ylabel("Wealth [$]")
plt.show()

Now lets plot the two curves together, notice the graph below. The answer to which method is more effective should now be obvious. With the passive investing model, the principal grows at a much faster/non-constant rate. Also, notice how the passive investment model performs worse than the linear savings model at first and then takes off.

Investing is very important. Whether you want to live lavishly or have capital to pursue your business ideas, investing can help you reach those goals! I hope you enjoyed this content and don’t forget to check back for more!